Not All Balanced Super Funds Are Equal
Balanced Industry Super Funds have generally outperformed retail benchmarks by assuming more risk. While this may work for younger investors, it may also represent a problem for older investors approaching retirement age.
2017 was a very good year for super funds. Markets were buoyant and turbulence nowhere in sight. According to a recent Chant West survey, the 2017 median return for Growth Funds was 10.8%. Industry Super Funds were the best performers, with the top five (5) funds generating an average return of 13.2%
Top 10 Performing Growth Funds (1 Year to December 2017 – %)
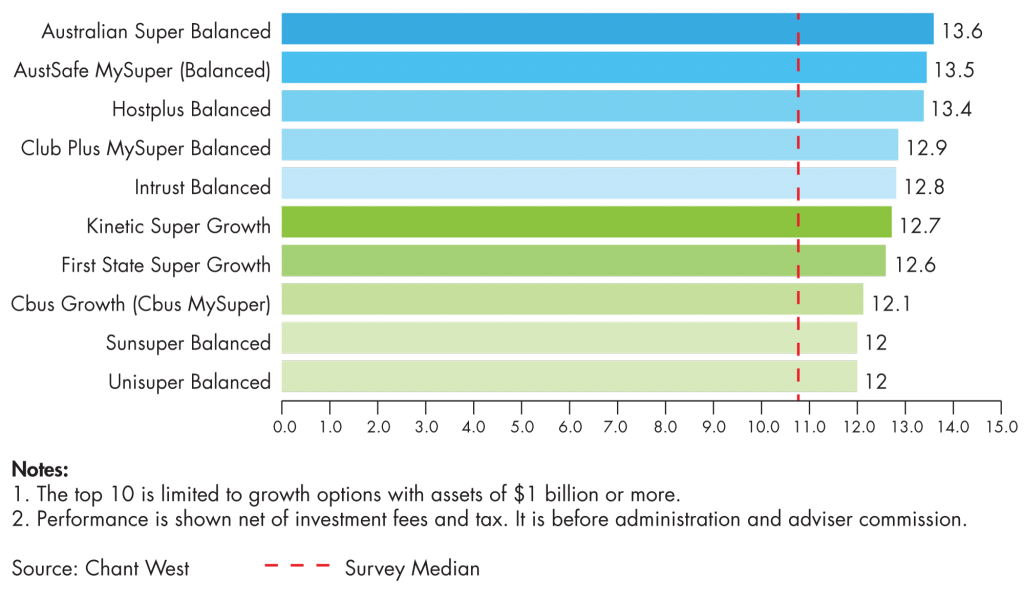
In comparing the returns of the “Top-5” Industry Funds with benchmarks generally used by retail advisors as proxies for Balanced, Growth and Aggressive funds, we observe significantly lower returns as highlighted in the table below.
Table 1

Table 1 highlights that industry funds convincingly outperformed retail funds across all risk profiles over 2017. This paper looks at the main factors behind the Top-5’s stellar performance, which will be of interest to consumers, regulators, super funds and advisors alike. Our analysis is limited to the “Top 5” funds, as detailed portfolio information on each fund surveyed is not generally available.
Do lower fees explain the higher returns of Industry Funds?
Industry Funds actively promote their low fees relative to retail funds, which is a feature of their not-for-profit structure. However, the above table looks at the returns of the Top-5 against the Morningstar benchmarks, which carry no fees. The Morningstar Indexes are composite portfolios exposed to eight (8) asset classes, against which advisors and fund managers benchmark their portfolio returns. They inform investors of how their portfolios are tracking in relative terms; and many struggle to out-perform the Morningstar Indexes due to the fee drag incurred by real portfolios against frictionless (nil fee) benchmarks. We extend our analysis to include the Future Fund, another not-for-profit organisation as well as the DFS Balanced Portfolio as a “for-profit” proxy for retail Balanced funds:
Table 2

Industry Funds allocated much more to Growth assets
Table 2 shows that the Future Fund and DFS Balanced Portfolio both under-performed the Top-5 over 2017, with Growth allocations similar to that of the Morningstar Balanced Index. Almost half of the Future Fund’s Growth allocation was directed to direct property & infrastructure (14%) and private equity investments (12%), highlighting that its returns are much less reliant on equity markets. The DFS Balanced Portfolio had no exposure to illiquid or direct assets.
The Top-5 industry funds had an average Growth allocation of 78% over 2017, which is significantly higher than the Morningstar proxies for Balanced & Growth portfolios. The Top-5’s Growth allocation was 53% greater than the Morningstar Balanced Index, in relative terms; and 13% higher than the Morningstar Growth Index. Only the Morningstar Aggressive Index had a higher allocation to Growth assets. We conclude that the high returns of the Top-5 was primarily due to higher Growth exposure (including direct real assets) rather than their not-for-profit structure. Such exposures were well rewarded over 2017, which was a particularly stable and buoyant period for risk assets. Indeed, while each of the Top-5 funds are labelled as “Balanced” portfolios, the equivalent retail portfolio would have had to equally allocate to the Morningstar Growth & Aggressive Indexes to assume a similar level of risk.
The median Growth Fund return of 10.8% also suggests that the funds surveyed allocated more to Growth assets compared to the Morningstar’s Balanced & Growth Indexes as well as DFS and the Future Fund.
Allocations to illiquid, long duration assets were rewarded
One fifth of the Top-5’s Growth allocation was allocated to property & infrastructure, which in large appears to be directly held. Direct property and infrastructure are illiquid, long-duration assets that have performed particularly well since the GFC, as yields compressed to historically low levels. Exposure to direct real assets would have meaningfully contributed to the returns of Industry Funds. According to a recent report by MSCI, PFA & Zenith, Australian direct property funds were the best performing asset classes in 2017, delivering performance three times stronger than Australian equities, with average total returns of 23.4%. The Top-5’s exposure to direct real assets was over five (5) times greater than each of the Morningstar benchmarks; and this appears to have amplified the extent of the Top-5’s outperformance over 2017.
How did the portfolios perform on a risk adjusted basis?
We applied a simple risk-adjusting measure to broadly equalise the risk of each fund and Morningstar Indexes to that of the Top-5. We did this by calculating a simple “growth ratio” to adjust their respective returns, as shown in the table below:
Table 3

We observe a meaningful convergence in returns once we make a simple risk-adjustment. However, the adjustment does not take into account illiquidity risk, which would further compress returns, if included. Nonetheless, a simple risk adjustment gets us much closer to a fairer comparison and is certainly much better than relying on returns that do not adjust for any risk.
Are Industry Super “Balanced” funds invested too aggressively?
According to superguide.com.au, the average member of the Top-5 has an account size of less than $26,000; and around 80% are under 50 years of age. Consequently, the Top-5 industry funds enjoy strong net investment inflows, as the 9.5%pa. super guarantee contributions largely offset their relatively small super-pension commitments. Therefore, it is highly appropriate for industry funds to have higher allocations to Growth assets and to invest in illiquid, long-duration assets to enhance long-term returns.
In contrast, Advisers would see the Top-5 industry funds as assertive portfolios rather than Balanced. The majority of Advisers service the “over 50s” market, with many having a strong skew to the 60-70+ year old segment. Most clients in these segments have amassed meaningful wealth; they are either retired or relatively close to retirement and generally require their portfolios to be more conservatively invested than the Top-5’s default options. They also have greater aversion to illiquid assets due to their ongoing need for regular income and/or capital accessibility.
What’s in a name?
We question whether it’s appropriate to describe portfolios that have large and permanent biases to growth assets as “Balanced”. While higher risk levels are warranted under the right circumstances, a “Balanced” description doesn’t seem quite right when around 80% of the portfolio is allocated to growth (risky) assets. It adds to consumer confusion, which many advisors will attest to. Consumers often compare the returns of their more conservatively invested “Balanced” portfolios to the more assertive “Balanced” industry funds, believing they are interchangeable (more or less) from a risk-return perspective. In reality and in spite of the identical labelling, we see significant differences in risk levels across the spectrum of “Balanced” portfolios, in which a large proportion of Australians are invested. While this issue has largely gone under the radar, greater guidance from the regulator would help to reduce confusion around risk labels. The regulator could for example, encourage investment managers with elevated Growth allocations to substantiate the basis on which their portfolios fit their respective risk-labels.
The timing of such guidance probably couldn’t come at a better time, given that prices of growth assets (and in particular direct real assets) have inflated significantly since 2012. Today, we are facing an environment of higher bond yields and increased market volatility, with the prospect of the current economic cycle approaching late-stage. Indeed, while highly stable conditions since 2012 have benefited portfolios with large and permanent Growth skews, they are exposed to greater downside risk as market conditions become more turbulent. Market turbulence becomes a real issue for those approaching retirement; and the cause of significant angst for those who have already retired.
It’s risky to assume that equity markets will consistently reward you
Equity markets can be prone to extended periods of price weakness
To emphasise, the following chart shows the real returns (after inflation) on the US equity market since 1900. It highlights that the direction of equities is far from certain even over longer periods of time. It shows that the S&P500 was in decline or recovering from declines, 89% of the time. While bull market conditions include recovery from declines (denoted by yellow lines), the overall message is sobering.
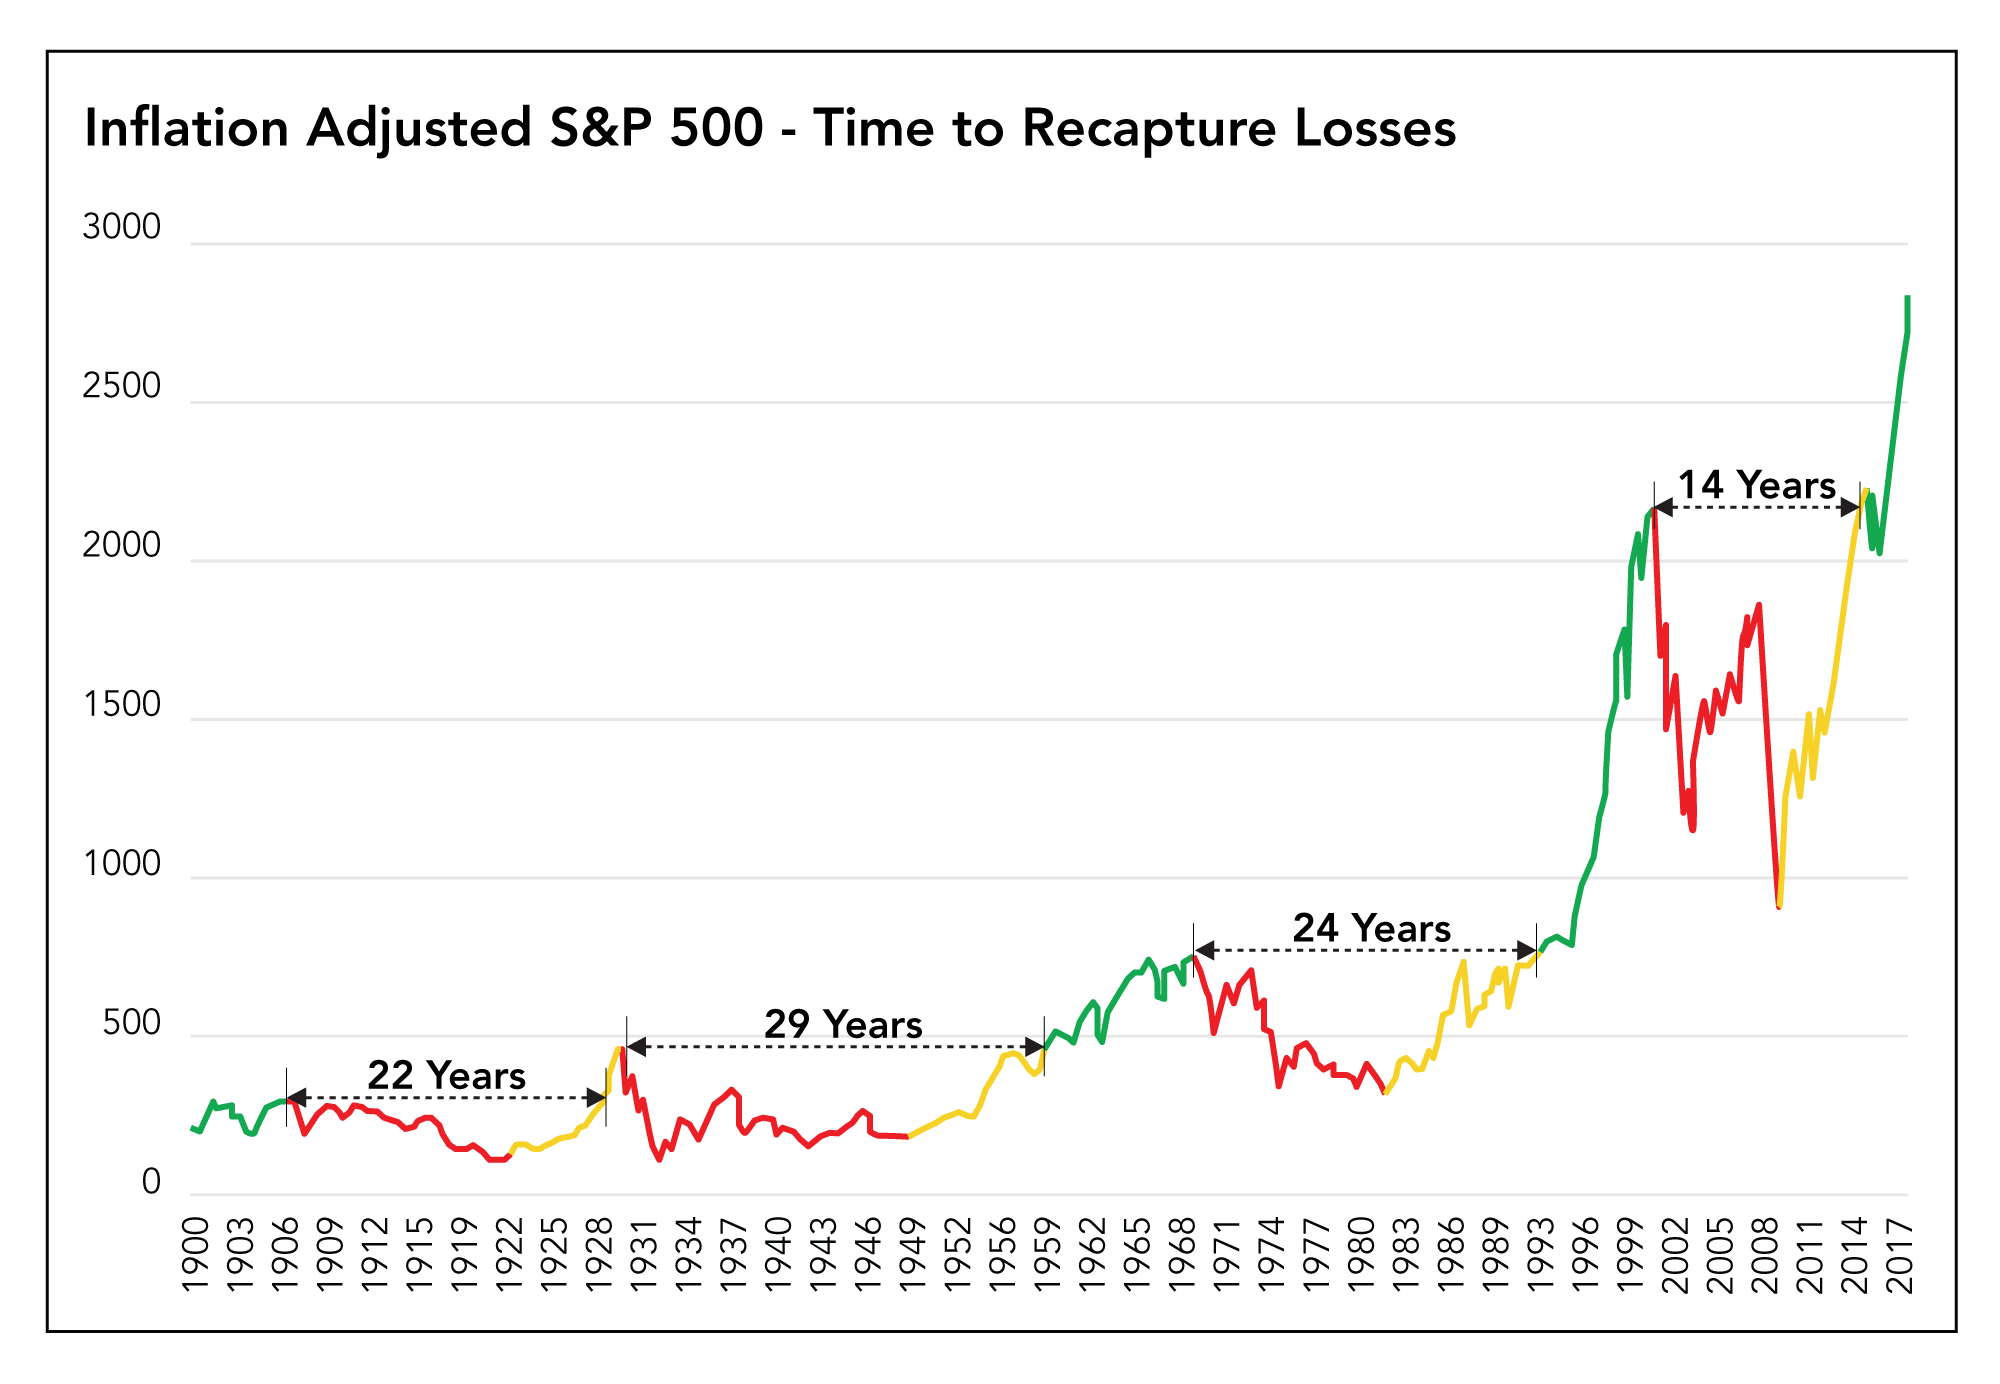
Source: Real Investment Advice
Van Eck recently analysed the nominal returns of the S&P500, since March 1928 and came up with the similar results. While US equities had been in a bull market 59% of the time, it experienced market declines 31% of the time; and was recovering from declines 38.7% of the time. It only spent 30.3% of the time creating new wealth.
Significant and permanent equity risk exposures may be highly rewarding in bull market conditions, however bear markets occur more often than one would otherwise believe.
Benchmarking your Portfolio Risk
In order to properly compare super fund performance, returns need to be adjusted for risk. This is important for investors approaching retirement age as they do not have the luxury of time required to recover from capital losses when markets turn down; and it’s particularly important for those already in retirement. Risk benchmarking is essential at this stage of your life as it provides you with a better understanding of portfolio risk. It allows you to better manage risk and protect you against market turbulence when it matters the most.
A good starting point is to derive your net annual returns and allocation to growth assets from your latest statement. This information can then be cross-referenced with the industry benchmarks in Table 3 to determine if you are being overexposed to risk. For instance, if you can achieve comparable returns with another fund that has a lower allocation to growth assets, you may wish to re-think your portfolio. Alternatively, if your fund is generating returns significantly above your expectations, this may also be a case for concern. Make sure you understand the risk your super fund is taking, as much can be lost if the risks are not sufficiently anchored.


