
Product Research
Evidence-based investment research
Our Investment Selection Service incorporates, active, passive and factor-based investments. It offers Advisers a robust and differentiated research input to assist in their internal model portfolio construction considerations.
Unconflicted Research Model
Our investment selection model receives no revenue from the fund managers that are exposed to our research process. Consequently we are not exposed to the obvious biases that result from such conflicted revenue models. Our service operates exclusively under a user pay basis and has an overarching objective to robustly scrutinise the risk adjusted performance of active managers against passive and systematic (factor-based) investment options.
Your Biggest Implementation Risk: Overpaying Managers for Beta & Insufficient Alpha
Our Investment Selection Service is particularly relevant for today’s Advice Practices, given the increased regulatory scrutiny around “know your product” and best interests obligations. Many Practices continue to provide product selection advice, where conviction on active strategies needs to be sufficient to overcome the meaningful fee drag. Indeed, active fees can be 5-10 times greater than passive options, the risk of which is ultimately assumed by the client.
Transparent Screening Outputs
Our Investment Selection Service helps you to better address the “know your product” obligation through regular research outputs. We equip you with unbiased and robust investment selection tools that supports your role as the key financial steward. The following chart shows examples of the risk-adjusted screens we regularly apply to active, passive and factor-based strategies:
AEQ-Value Strategies

AEQ-Neutral Strategies

How to read the chart
The charts show the rolling risk-adjusted performance of different strategies under each category and includes passive and factor-based investments. A Performance Indicator (DFSPI) score of 0 effectively represents the median risk-adjusted performance for each category, with values above (below) the median score denoting superior (inferior) risk-adjusted performance. We note the following:
- Dark blue denotes poor risk-adjusted performance
- Red denotes strong risk-adjusted performance
- Many active strategies have DFSPI scores meaningfully below that of the market benchmark
- Neutral-oriented strategies generally fared better than Value oriented strategies over the last ten years
The above charts attest to the evidence-based nature of our Investment Selection Service, which efficiently substantiates the basis of each strategy screened out. We generally find that less than 20% of strategies pass the initial screen. These short-listed strategies would generally be referred to as Investment Grade and above in the traditional APL construct.
The short-listed strategies are subjected to further analysis, where we systematically decompose their returns and risk exposures as highlighted in the chart below. The first chart shows an example of unremarkable characteristics that we typically see across many strategies, whereas the second set of charts uncover scarce characteristics that we seek from active and factor-based strategies :
The importance of understanding the return drivers for each strategy
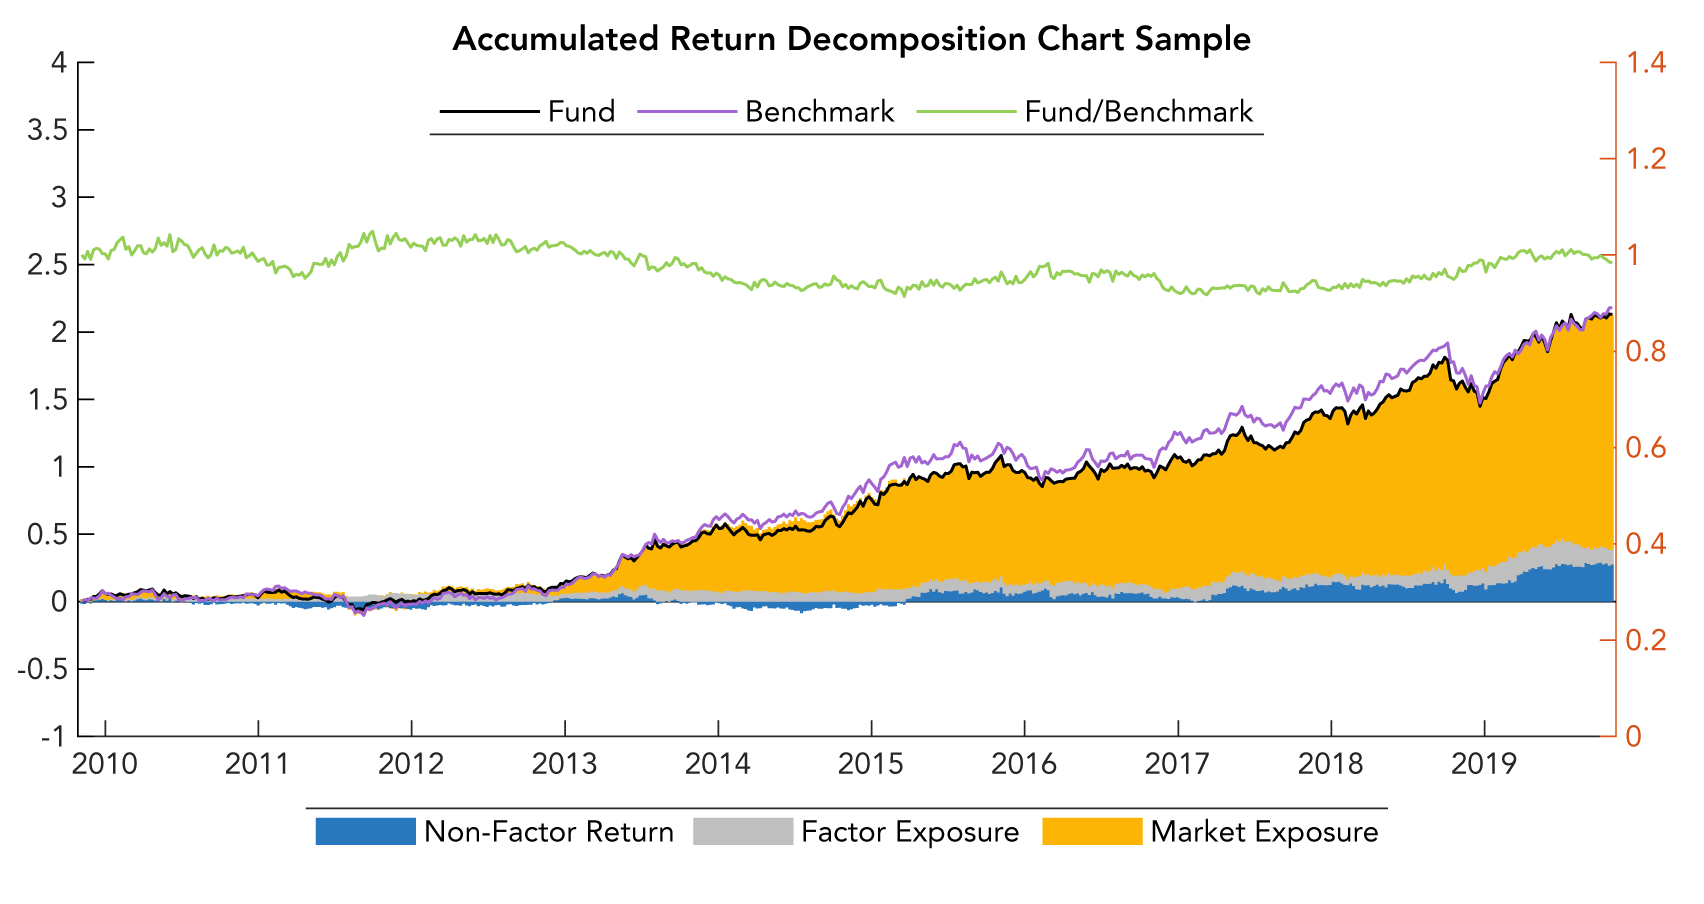
The Accumulation chart decomposes the return sources into 3 categories, namely: (1) market beta (yellow); (2) factor returns (grey); and (3) alpha or non-factor returns (blue).
For this strategy, most of its return has come from market beta (yellow); and secondarily from non-factor returns (blue). Factor exposures (grey) have marginally contributed to returns.
The green line plots the strategy’s return against the benchmark return. It denotes that the strategy is outperforming (underperforming) the benchmark when the line is upward (downward) sloping.
The Accumulated return charts below are applied examples of some of the short-listed strategies, which show the source and extent of outperformance of each respective strategy against the market benchmark. We note that various return sources at differing periods that has contributed to the outperformance at different time periods.


