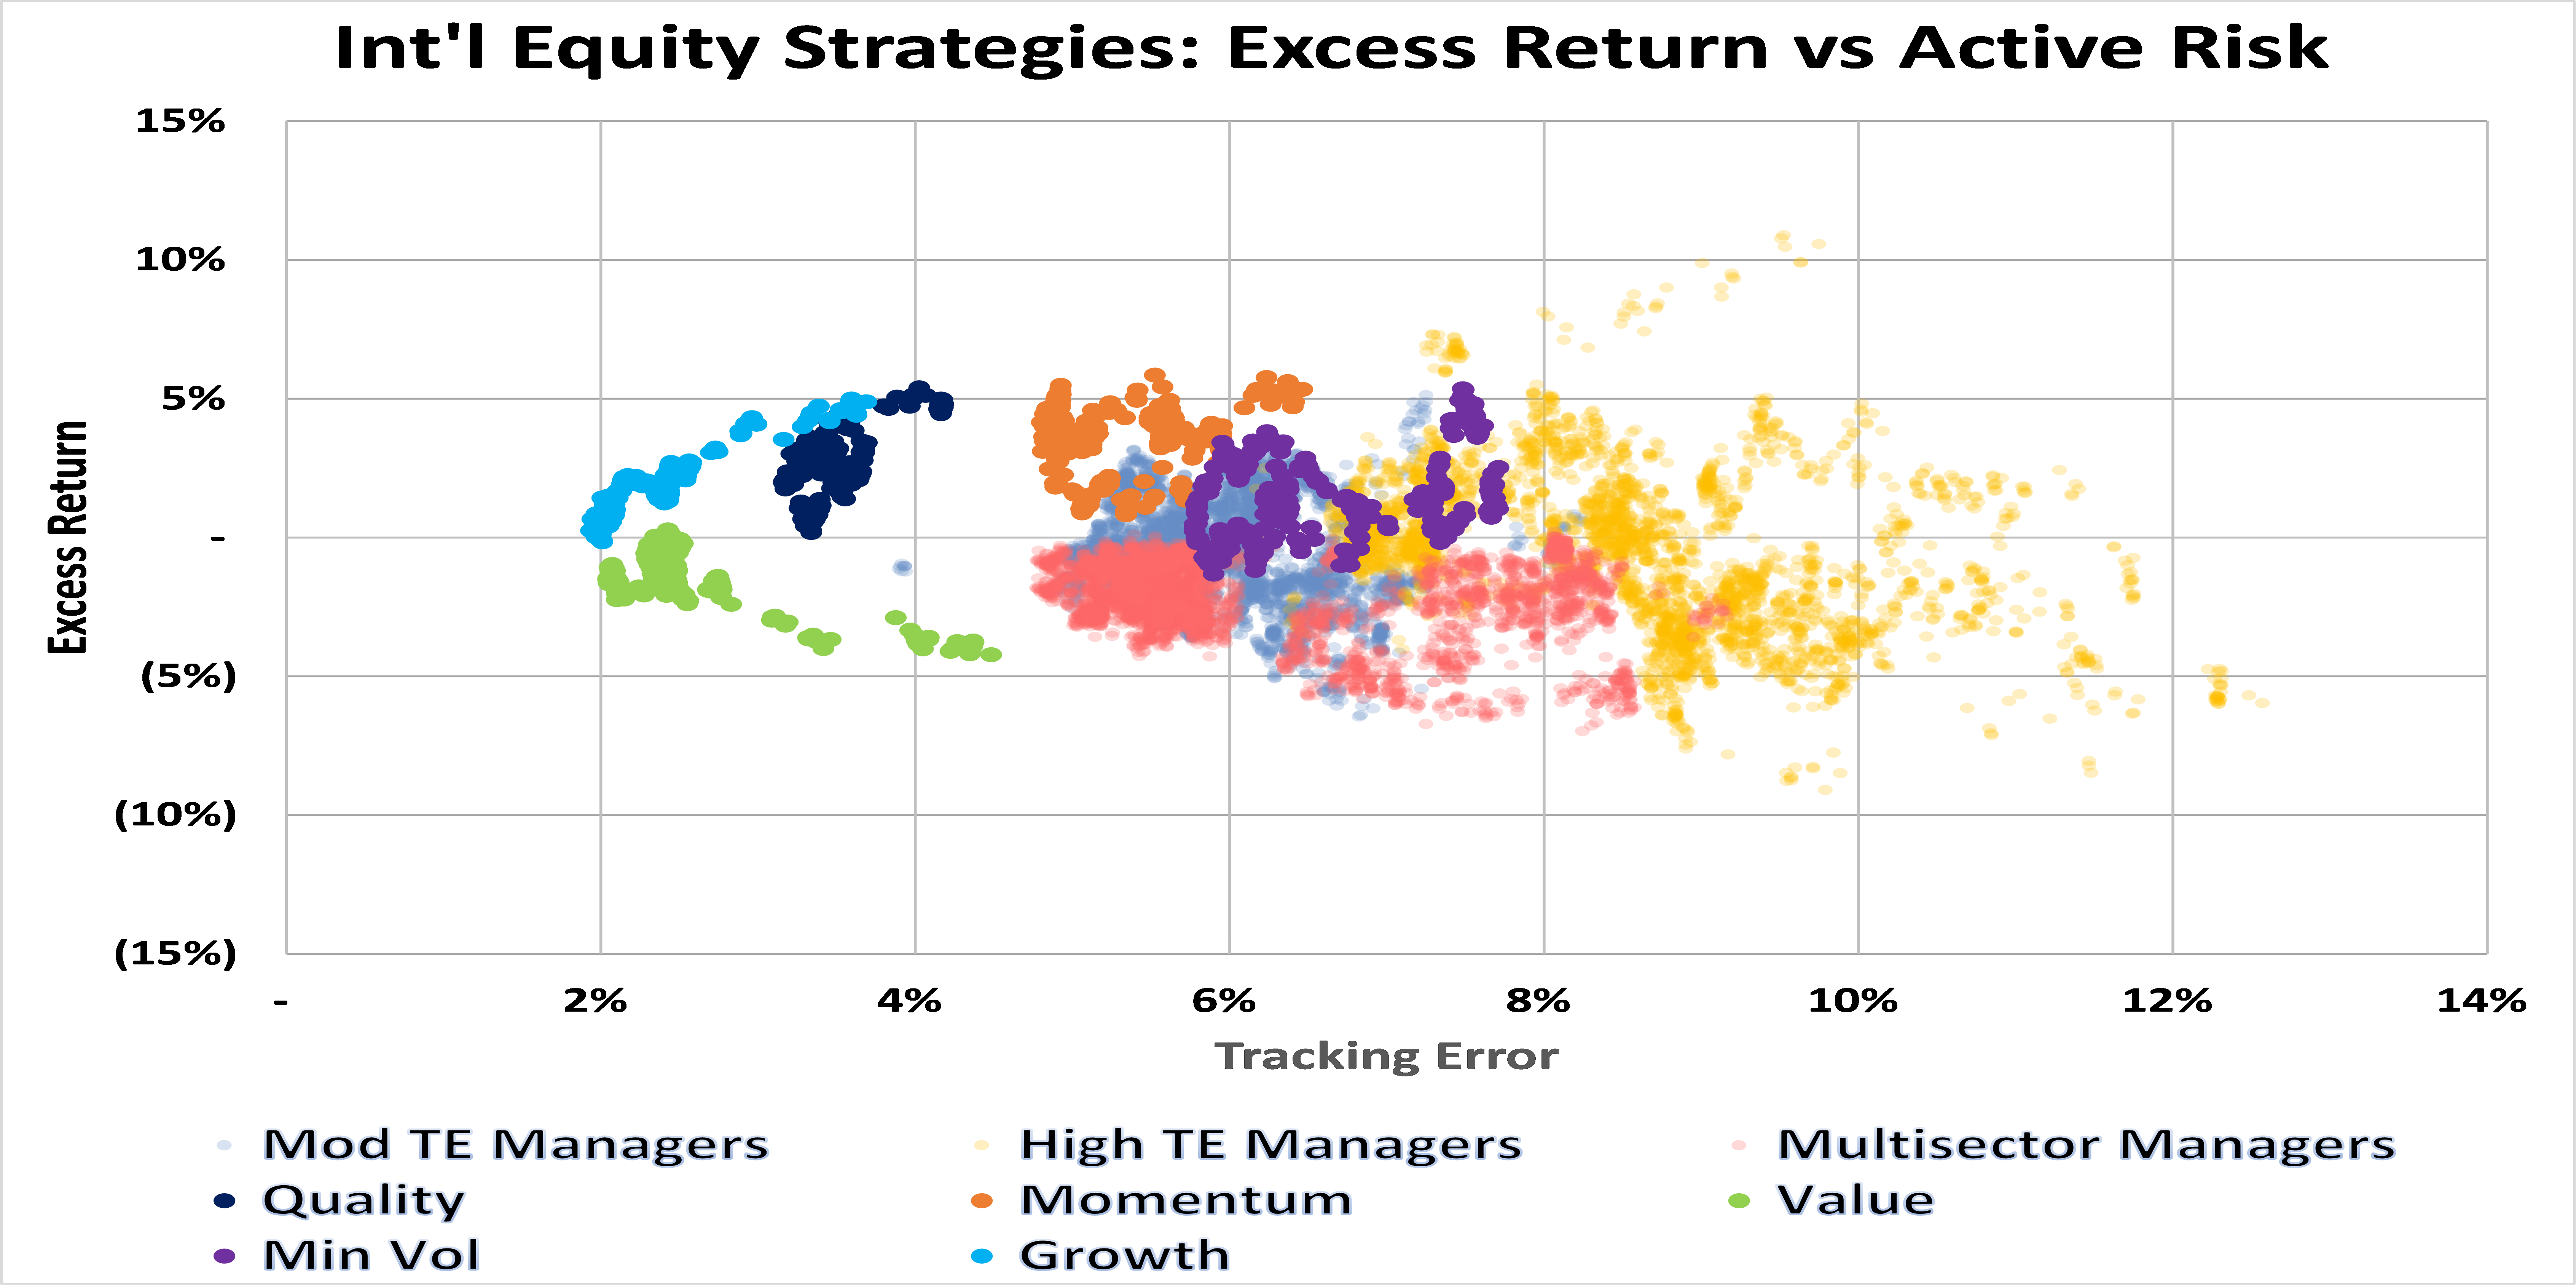
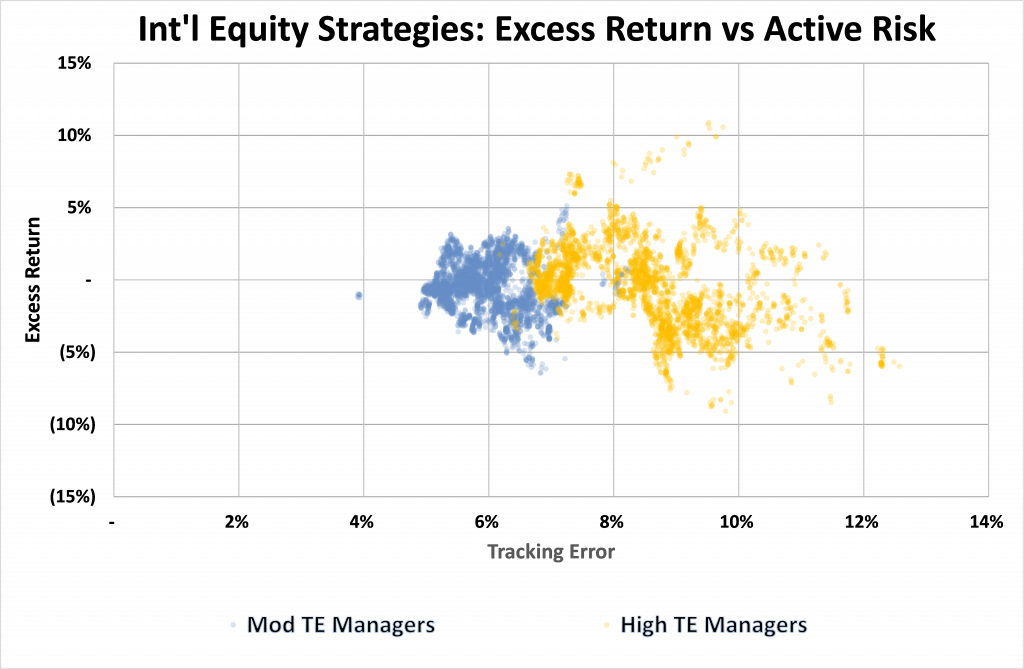
The featured chart plots the rolling 5-year excess returns and active risk (aka tracking error) outcomes of: (i) MSCI’s factor based strategies; (ii) 30 active strategies short-listed in our recent sector review, which are partitioned into Moderate Tracking Error & High Tracking Error strategies; and (iii) 14 institutional multi-manager strategies. The analysis covers the period from September 2009 to September 2020 and provides us with some interesting insights.
Observations
Firstly, the analysis highlights that return outcomes are uncertain. In general, the higher the active risk, the higher the return dispersion.
Secondly, in comparison to our Australian Equity analysis located here, international equity strategies assume higher levels of active risk. This highlights the shallowness of the domestic strategies, which generally benchmark against 300 stocks (S&P/ASX300 Index) in comparison to international equity strategies which benchmark against some 1,500 stocks (MSCI World Ex-Aust Index).
Factor based strategies
The following chart limits the risk-return analysis to the factor based strategies. It shows meaningful risk-return dispersion across the factor-based strategies. Value & Growth factors have assumed the lowest level of active risk, followed by Quality. Momentum & Minimum Volatility factors have by far assumed the highest risk.
In terms of excess returns, all investment styles experienced significant positive skews except Value, which under-performed chronically over the last decade.

Short-listed active strategies
Turning to our short-listed active strategies, we see higher levels of tracking error with a bias to under-performance as highlighted in the next chart. That is, active risk has been penalised more than it has been rewarded; and this suggests that a meaningful proportion of the active strategies have: (i) assumed lower levels of market beta; and/or (ii) been exposed to under-performing Value stocks; and/or (iii) been exposed to idiosyncratic risks that generate insufficient returns. Given that the short-listed strategies represent the top 25% of the broad peer group, it underscores how challenging conditions have been for many active managers over the last decade. Out-performing strategies have been largely been exposed to Growth stocks, which in turn have been highly correlated to Quality and Momentum factors.
Multi-manager strategies
The next chart isolates the multi-manager strategies so we can gain a clearer picture of their risk/reward outcomes. It shows compressed levels of active risk compared to the short-listed active strategies. This is not entirely unexpected, as multi-manager funds tend to be more diversified as a function of combining multiple complementary strategies. The more surprising observation is that essentially all multi-manager funds have under-performed across the 11 year period under analysis. Given their tracking errors lie between 4.5% and 9%pa, the under-performance does not appear to be a function of over-diversification, but rather due to meaningful Value biases and/or insufficient idiosyncratic return generation.

Where to from here ?
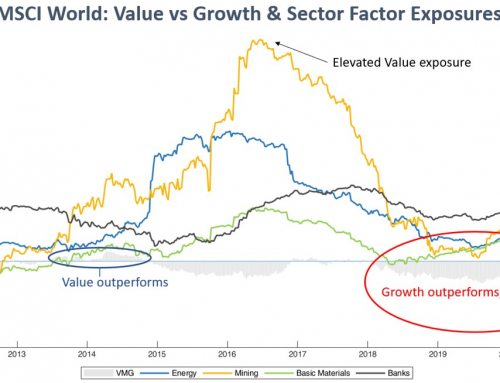
Strategies that have outperformed over the last decade have been those with significant exposures to the Growth factor, which in turn has been correlated to large cap, Quality & Momentum stocks. The accumulation charts below highlight the extent of out-performance of each major investment style relative to Value since September 2009:
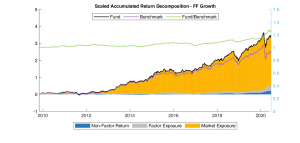


Looking at the sectors that have done well over the last decade, it has very much been a case of Healthcare performing well over the first half, with IT taking over in the second, as shown by the charts below:


An upward sloping green line (Fund/Benchmark) denotes out-performance against the market benchmark; and we can see a strong upward trend in Healthcare up to 2017. In contrast, the Fund/Benchmark line for the IT sector is quite flat up until 2014; and then trends upwards thereafter, accelerating strongly from late 2019. The secondary y-axis shows that Healthcare outperformed the broad market benchmark by around 40% since September 2009. The IT sector out-performed by around 100%, with about half of it being generated in the last 2 years !
Strategies that have performed well over the last decade have no doubt been meaningfully exposed to IT and/or Healthcare. All other sectors other than Consumer Discretionary have under-performed. Those strategies that have sought to diversify across all (or most) sectors would almost certainly have experienced significant performance drags, which most probably explains the sobering returns posted by the multi-managers and the under-performing active managers short-listed in our review. This suggests that diversification hasn’t worked well over the last decade in what has certainly been an unusual decade …?
While diversification has largely been unrewarded since the GFC, it’s something you wouldn’t want to necessarily bet against over the next decade. We need to remind ourselves that past performance is not a particularly good indicator of future performance; and appropriately diversified portfolios that focus on both Quality and Value characteristics are likely to to be more rewarding compared to future returns of past winners.
Consequently, portfolio construction approaches need to give greater attention to the inherent levels of active risk and apply techniques to better capture the returns being targeted (i.e. market beta, factor betas, idiosyncratic returns). In place of blunt product oriented approaches, a more granular and transparent approach is required to provide robust risk-return outcomes in an environment that rewards diversification. While it hasn’t worked particularly well over the last decade, it likely to do so as markets normalise.
If such an approach strikes a chord or if you wish to investigate further, please feel free to drop us a line.
Disclaimer