The way we think about risk is closely aligned to the way clients think about risk. Our objective is to stabilise portfolio risk and we do this by changing the asset allocation as we observe changes in risk levels. The chart below shows that while the average risk level (standard deviation) of the Morningstar Balanced Category Index (a proxy for a conventionally managed portfolio) has been 6%p.a., it’s been as high as 12%p.a. and as low as 3%p.a. When clients are exposed to higher levels of risk, they feel anxious and some capitulate. In contrast, DFS Portfolio Solutions manages the risk by targeting a specific risk level (of 6% under in this example) across ALL market conditions. In doing so, the risk tolerance of investors is less likely to be breached.
As a complement to the risk-targeting process, DFS Portfolio Solutions applies an additional equity-risk management overlay. Equity risk is the most dominant portfolio risk factor and typically accounts for 50% of the total risk of Conservative Portfolios and up to 90% of the risk of Balanced Portfolios.
The following chart shows how the actual asset allocation of our Balanced Portfolio has responded to changes in portfolio risk (as denoted by the black line).
The above chart shows the following:
- a rotation to Growth assets in 2012 as volatility reduced, coming out the European banking crisis and Greek default/exit concerns
- the asset allocation remained largely unchanged from mid-2012 to mid-2014 as market conditions remained very stable (we did not fiddle as there was no reason to do so)
- a meaningful rotation to Defensive assets from mid-2014 to Mar-2016 (risk increased due to concerns around US Fed tapering, China slowdown; and Commodity sell-off)
- a rotation to risks assets in March & April 2016 as market risks abated
The above chart further shows that Alternatives have been receiving a healthy chunk of the defensive risk budget as yield compression within defensive investments makes them an increasingly riskier proposition. Our liquid Alternatives Model exceeded its cash benchmark by 5.6% over the last 12 months to 30 June 2016.
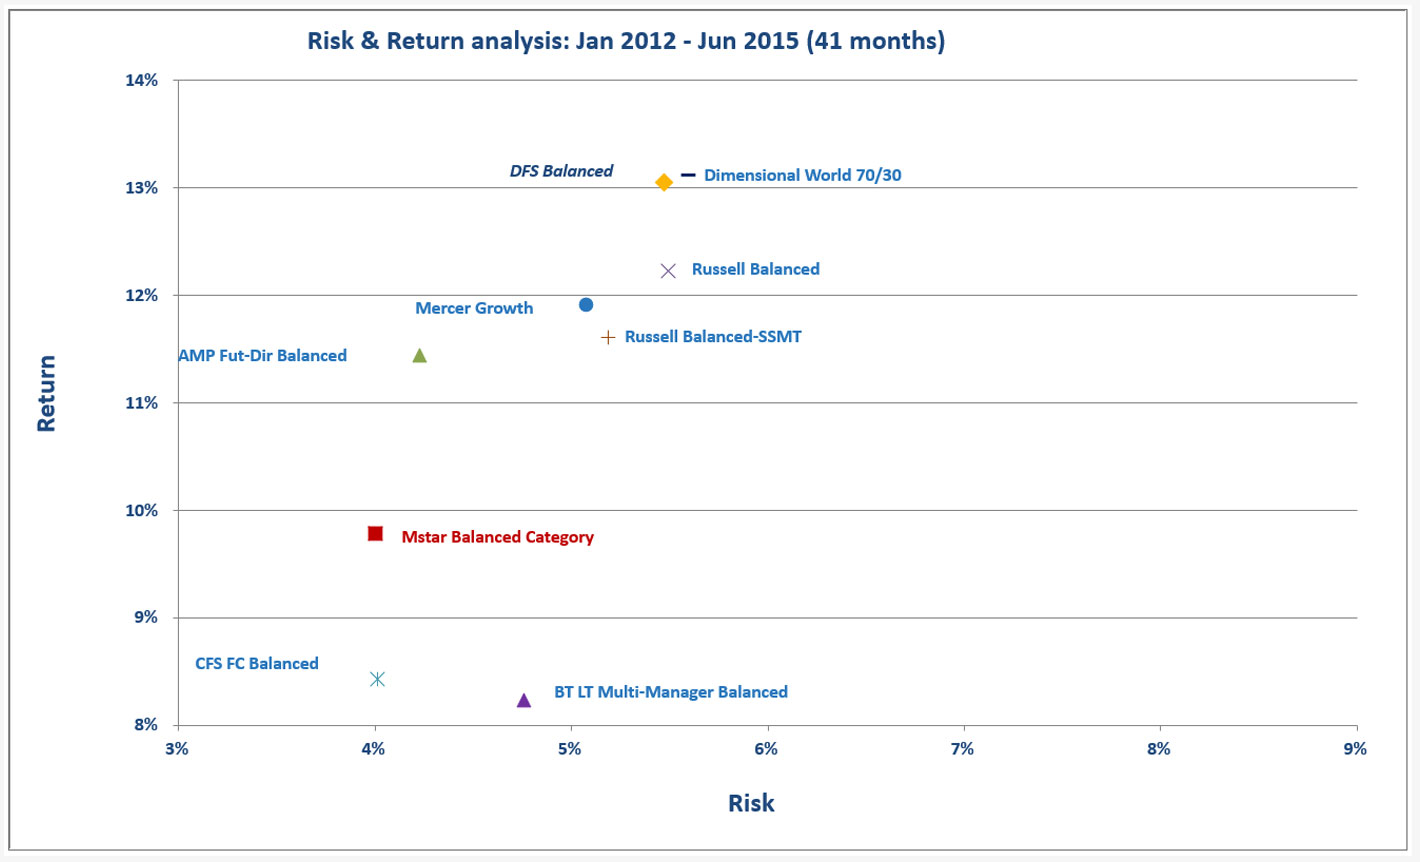
The chart below shows how our Balanced Portfolio has performed in stable market conditions. Its risk level (by design) is at the upper end of the peer group as we wish to take on more risk when it pays to do so.
The next chart shows how our Balanced Model has performed in the more recent volatile market conditions. This time, the risk assumed is at the lower end of the peer group. Indeed, the risk level of our Balanced Portfolio has been most stable; it moved incrementally from ~5.5% to ~5.6% whereas, the Mercer & Dimensional portfolios, for example have moved more substantially from ~5.5% to ~8.6%.
We re-iterate our interest in working with Advisory and Accounting firms that wish to deliver robust, agile & responsible portfolio management solutions for their clients. A dynamic asset allocation approach that explicitly seeks to stabilise portfolio risk is precisely what investors need in an increasingly uncertain world.


