The relevance of active management
The relevance of active management continues to be questioned, particularly under conditions awash with liquidity. The sheer number of underperforming active strategies certainly supports this negative perception. Of the 220 Australian equity strategies we recently reviewed, around 80% were screened out, which we largely see as manufactured products that impose high fees. Instead, our focus is directed to a short-list on which judgements on active management are made.
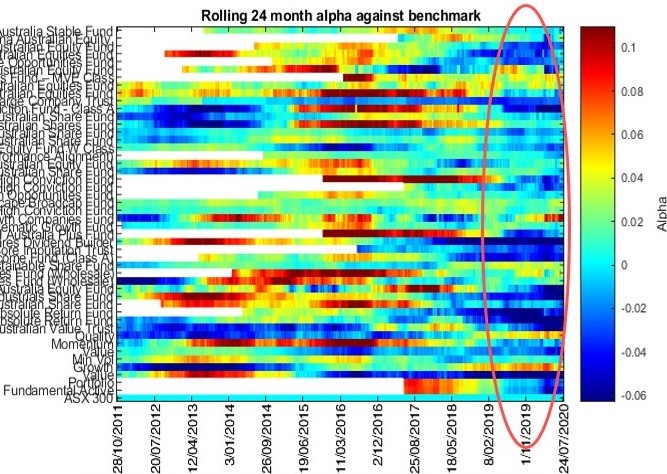
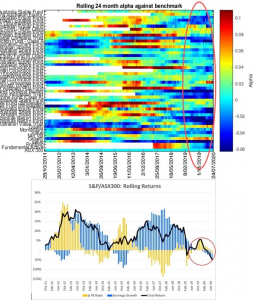
The chart below looks at the rolling 2-year excess returns generated by each short-listed strategy (noted as Alpha), which has ranged between -6%pa and +10%pa. We can see periods where active strategies outperformed (denoted by red, yellow, and green); and periods of underperformance (denoted by blue).
The chart highlights that the short-listed strategies generally performed well against the benchmark over the last decade. The exception of course is the recent blue dominated period. Given the general underperformance has been limited to the last 3-years, wholesale judgments against the viability of active management appear to be unfounded. We believe the recent underperformance is largely anomalous, based on the following reasoning.
Earnings Growth vs Changes in PE Ratio
The chart below shows the equity market’s rolling 2-year returns partitioned into: (1) earnings growth; and (2) changes in the PE ratio. We see that both changes in PEs and earnings growth meaningfully influence market returns at different stages of the market cycle. Whereas earnings growth is more of a fundamental measure, the forces that drive changes in PEs are more sentiment driven.
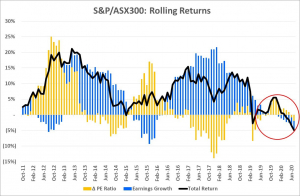
We see that changes in the PE ratio added up to 25% p.a. to the market’s total return (2012) and detracted by as much as -14% p.a. (2017). The peak attribution of earnings growth was 22% p.a. (2017), with a trough of -9% p.a. (2015). Returns from each component have significantly compressed since early 2019 (as highlighted in red), thereby keeping the total market return to around +/-5% since 2017.
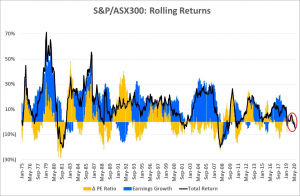
The chart below looks at the recent anomalous period in the context of the longer term. Over the long term, PE expansions and contractions largely cancel out. However, over the short to medium term, meaningful dispersion in PEs and earnings growth can be exploited by active strategies. Such opportunities have largely contracted since late 2017, as highlighted below:
Aligning recent performance with market conditions
We believe the recent anomalous period is largely explained by:
- Contraction of returns: from changes in PE and falling earnings growth, which reduce stock picking opportunities for active managers
- Exposure to earnings growth: the vast majority of the short-listed strategies have been exposed to earnings growth since late 2017. Given returns from earnings growth have fallen and become negative, most active strategies have found themselves on the wrong side of the trade.
We see a strong relationship between the rolling the 2 year alpha chart and the partitioned returns (∆ PE & Earnings Growth), as highlighted below:
Normalisation to favour active strategies
Given the recent anomalous period of underperofmance, we see improving prospects for active strategies as earnings growth recovers and returns from PE dispersion begin to normalise. At the aggregated model level, exposure to earnings growth is preferred over a reliance on PE expansion to generate outperformance. In this regard, we favour returns generated through fundamentals rather than positive market sentiment. While the timing of normalisation is always difficult, we believe it will likely revert in the short to medium term.
The next challenge for wealth managers is to work out what proportion of their Australian equities should be allocated to active versus passive strategies; and in turn, of the active strategies, how much should be managed fundamentally versus systematically. Our recent post provides some guidance, which you can access here.
Please feel free to drop us a line should you wish to investigate further.
Disclaimer

