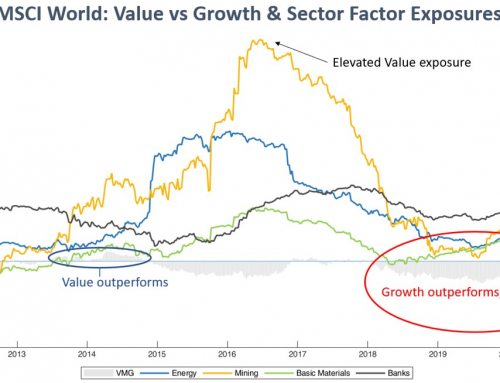
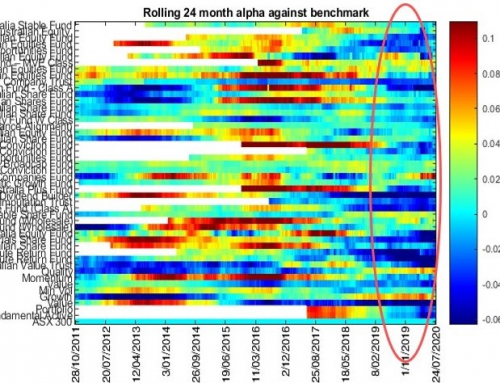
Active, passive and factor investing each have important portfolio construction roles to play. Passive and factor-based investing enable the systematic and efficient access to market & factor betas. Active investing provides the potential to further diversify portfolios by accessing true alpha (or non-market) returns, for which higher fees are justified. However, active managers need to be scrutinised regularly and rigorously to ensure that excessive fees are not being paid on exposures that are readily accessible. We see this as the biggest and most costly implementation risk for advisors. Implementation processes can also incorporate techniques that dynamically measure the opportunity set for active management against passive and factor-based investing to adjust allocations across each investment approach.
The following paper provides an example of such a framework. It applies an evidence-based process that regularly scrutinises the performance of active managers against passive and factor-based investment options. We generally find that: (i) market returns dominate the performance outcomes for each investment approach; (ii) factor biases tend not to be a meaningful source of value for most fundamental active managers; and (iii) alpha generation has generally been inconsistent and largely diminished in the last few years.
Prior to taking a closer look at our analysis, we provide a recap on each investment approach:
Passive Investing (market return)
Passive investing seeks to capture the market-return or market-beta by proportionately investing in stocks (or securities) that make up a given market. It has no regard for “stock-specific” returns, apart from their marginal contribution to the overall market return. Capital is therefore allocated to stocks based on their proportionate weight within the market index. It requires no fundamental analysis. For example, the largest single allocation for a passive Australian equity fund is CBA as it’s the largest listed Australian stock, making up some 7.5% of the ASX200. Whether it represents good or poor value from a fundamental perspective is irrelevant; passive approaches defer to the market composition when allocating capital to the market. It requires no particular skill to generate.
Active Investing (market + stock specific returns)
In contrast, active managers seek to outperform the market by capturing stock-specific opportunities, which is generally referred to as alpha. They generally employ fundamental approaches to analyse the value of stocks, and skew allocations to those that offer the greatest value. In the case of CBA, an active manager is likely to allocate more than 7.5% to the stock if it believes the share price is trading meaningfully below its real (intrinsic) value; or it may allocate less (or nil, or sell short) if it believes the stock is expensive. The notion of relative value therefore drives the capital allocation decisions of active managers. Research is required to determine which stocks offer better value, which of course is more costly than a passive process that allocates funds based on the market composition. In order to sustain their strategies, active managers must be able outperform the market return, net of fees over the full market cycle.
Factor Investing (market + factor-beta returns)
Factor investing infers that a meaningful portion of alpha generated by active managers can be explained by some common factor risks that exist across stocks, and which can be systematically captured. Such risk-factors have been well documented through academic literature over many years, which include equity- based risk-factors such as: Value, Quality, Momentum and Low Volatility. Proponents of factor investing assert that the proportion of alpha significantly diminishes after capturing these factor-betas. Factor investing is also marketed as enhanced indexing and smart beta.
LONG TERM TRACK RECORD
Let’s look at how active managers have fared against passive and factor styles since 2001:
Exhibit 1:
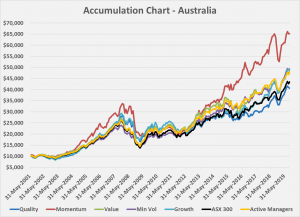
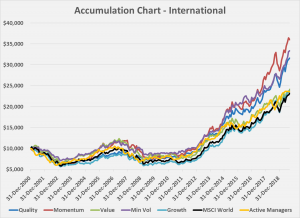
The above charts plot the accumulated returns of Australian & International equity markets (ASX300 & MSCI World) against their respective factor indexes and proxies for average Active manager returns. They show that each factor (with the exception of AEQ-Quality) outperformed the market benchmark over the longer term, as did the average Active manager, net of fees. The Momentum factor has been most rewarded. However, we observe its drawdowns are much deeper during market selloffs (2007-2009; 2016-2017; 2018).
The chart below focuses on the last 5-year returns; and we can see that active managers have struggled to add value alongside the Value factor (and Quality factor within Australian equities).
Exhibit 2:
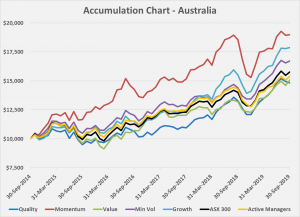
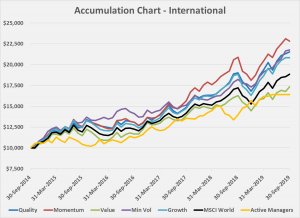
We question the return drivers across active managers over this recent period, given that they have been largely unrewarded compared to passive and factor-based investing.
WHAT’S DRIVING RETURNS?
We pay particular attention to the risk exposures and return drivers to understand what’s behind the performance of managers. Returns are decomposed as follows:
- Market returns: due to exposure to the broader market: these returns are much like those of an index fund and require no particular skill to generate.
- Factor returns: due to exposure to various style factors: Quality, Momentum, Minimum Volatility or Value. These have been identified as potentially offering better returns over the long run, but different factors perform well at different times. There are ETFs and managed funds available to provide cost effective exposure to these style factors. They also help reveal possible biases in an active fund’s investment strategy, but typically aren’t a meaningful source of the manager’s ‘value add’.
- Non-factor returns: these are the returns due to a manager’s active stock selection decisions. If a manager has genuine skill to beat the market, this is where we expect it to show up. We are prepared to pay active fees for such skill. Positive non-factor returns mean that the decisions the manager makes have been rewarded.
To illustrate, the chart below shows the rolling 2-year return (black line) of an active Australian equity manager, which has consistently outperformed the benchmark (grey line).
Exhibit 3: Rolling 2Yr Return Decomposition Chart
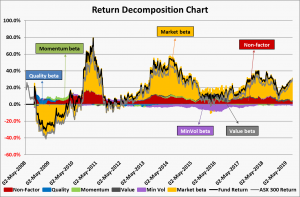
We see that market-beta (yellow shaded area) has been the major source of return and observe mixed contributions from factor betas. The manager’s short exposure to MinVol has detracted from returns (purple shaded area) since 2013; however its short Value exposure has contributed positively to returns (grey shaded area). We conclude that the manager has no real style bias and that it has consistently generated returns unrelated to market & factor exposures. Such returns (red shaded area) are due to the manager’s active stock selection decisions; and on which active fees are justified.
FACTOR BASED
While market returns (yellow) dominate the returns of factor-based approaches, it’s not the only return driver. As highlighted in the charts below, we see factor-betas (red) contributing to returns at times and detracting at other times:
Exhibit 4: Rolling 2Yr Return Decomposition Charts
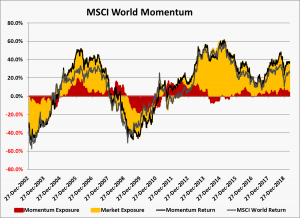
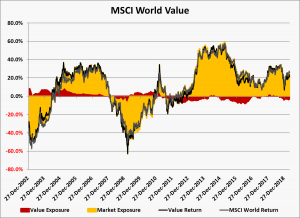
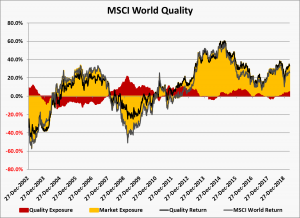
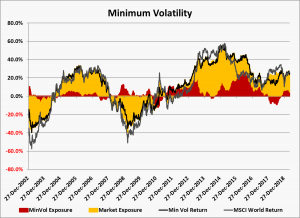
We further note the ebbs and flows of the factors and their complementary return contribution. Overall, factor-based investing provides potential to outperform passive strategies and extends the implementation options beyond the choice of active and/or passive. In general, a disciplined and patient approach to factor investing is likely to be rewarded. Alternatively, asset allocators may tilt to factors that are expected to outperform, giving regard to prevailing market conditions. For example, we can see that Momentum shows greater sensitivity to drawdown risk compared to the Quality, Value & MinVol factors, yet it does better under buoyant market conditions.
PASSIVE
Passive funds offer cost effective access to market returns as highlighted in the chart below:
Exhibit 5: Rolling 2Yr Return Decomposition Chart
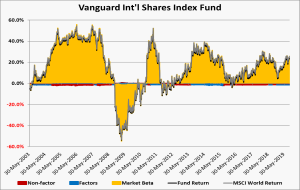
As expected, the above chart shows that the returns of Vanguard’s International Index Fund are entirely made up of market returns (yellow shaded area). Its rolling 2-Year return (black line) tightly tracks the benchmark (grey line) and there’s essentially nothing else other than market beta that’s driving its return.
ACTIVE
Active management is justified on the basis that it outperforms its benchmark (net of fees) over a full cycle. While excess returns are generally referred to as alpha, we decompose market beta & factor-betas to derive the managers’ true alpha. We present our analysis of several highly rated Australian equity managers below, which have produced mixed results:
Exhibit 6: Rolling 2Yr Return Decomposition Charts of Australian Equity Managers
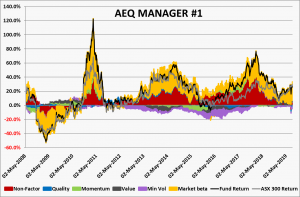
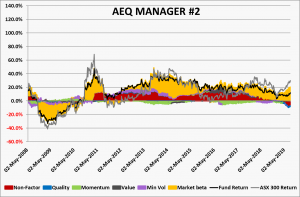
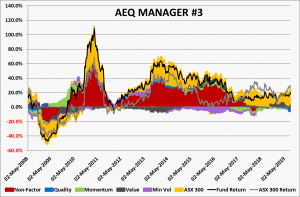
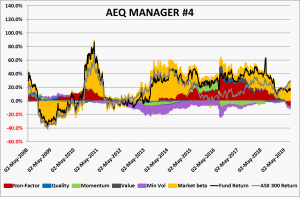
The above exhibit shows that each of these active managers has generated significant levels of alpha (non-factor returns) over time. Apart from Manager #2, which has consistently assumed low levels of market beta, each has substantially outperformed the benchmark for most of the period under analysis. However, alpha generation has effectively dropped off over the last few years, as the volume of money following liquidity (i.e. sentiment) has intensified. While each manager has a differentiated investment strategy, the recent absence of alpha appears to be systematic, exposing a depleted opportunity set for active managers.
We observe a similar pattern from highly rated international equity managers:
Exhibit 7: Rolling 2Yr Return Decomposition Charts of International Equity Managers
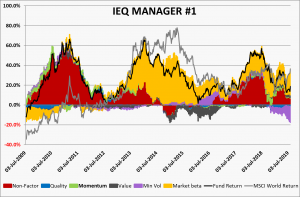
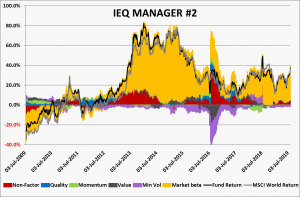
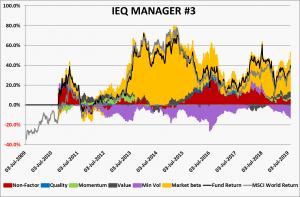
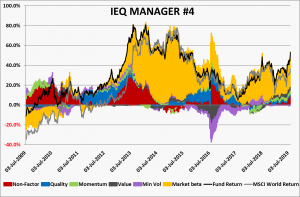
Once again, we observe that each active manager has been able to generate meaningful levels of alpha (non-factor returns) over various stages of the cycle. We can also see that Manager #4 has benefited from its Momentum & Quality exposures (green & blue shaded areas) over time; and more recently from its positioning across multiple factors. Finally, as per our findings of Australian equity managers, alpha (non-market) returns have reduced in recent years.
CONCLUSION
Advisors and wealth managers have broad responsibilities, which often includes portfolio management. After determining the risk profile and establishing the asset allocation, portfolio implementation is the next step to resolve. The decision will likely be guided by client preferences and those of their Advisors, which can often be influenced by performance recently experienced. For example, where actively implemented portfolios generally fared well for a good part of the last decade, passive portfolios have performed strongly in the current decade. Unsurprisingly, the push towards passive investing continues to intensify given this recent experience. Interest in factor-based investing is also growing, adding further color and complexity to the active-passive debate.
Looking ahead, we question which investment approach is likely to fare better. Just because a particular approach has worked well in the recent past, doesn’t necessarily mean it will work well in the future. Likewise, there’s no guarantee that active investing will come back into vogue just because it’s fallen out of favour for some time. Given the inherent uncertainty in forecasting, advisors need to be supported by an evidence-based process that regularly scrutinises the performance of active managers against passive and factor-based investment options. Such approaches better support and represent advisers as fiduciaries.


