Summary
- Our 2019/2020 Australian Equity Review covered 153 strategies
- 101 strategies were screened out due to inconsistent and/or insufficient risk-adjusted return generation; and a short-list of 42 strategies were subjected to further review
- An average market beta of 0.85 was observed across the short-list which should largely buffer the extent of downside experienced in the current sell-off
- Superior strategies are likely to gain idiosyncratic traction and outperform in the ensuing recovery
Australian Equity Review – 2019/2020
Our 2019/2020 Broad Cap Australian Equity Review covered 153 active strategies, from which a short-list of 42 were subjected to further review. Ultimately, 15 were identified as superior strategies that form our Reserve-list.
As identified in our December 2019 post: A year that most Active equity strategies want to forget, 2019 was generally a poor year for active strategies. Active strategies had lower market beta at a time when equity markets were surging, while their alpha return generation was poor. As a result they have under-performed in recent years. The Covid-19 induced market volatility is likely to offer a materially different and potentially rewarding environment for fundamental, bottom-up strategies.
This article asks whether active strategies can outperform in the current environment and during the later recovery. We are looking specifically at strategies that have shown clear differences from their peers.
What’s driving returns ?
Active strategies justifiably charge higher base fees to cover the higher cost of stock specific research compared to passive approaches. Yet, the last few years have challenged many active strategies and exposed sensitivities to their high relative cost, which is often 5-10 times greater than passive options. It’s incumbent on fiduciaries to make appropriate risk-reward assessments when advising clients on investment selection decisions. We find it helpful to systematically decompose the risk and return drivers to understand what’s behind the performance of each strategy:
- Market returns: due to exposure to the broader market; these returns are much like those of an index fund and require no particular skill to generate.
- Factor returns: due to exposure to various style factors such as: Quality, Momentum, Minimum Volatility, Growth, Value. They help reveal possible biases of each strategy.
- Non-factor returns: or idiosyncratic returns (alpha) due to active stock selection decisions. If a strategy has genuine skill to beat the market, this is where we expect it to show up.
Whereas market returns are accessed cheaply and factor-based exposures modestly, we should only be prepared to pay higher active fees for strategies that can generate sufficient non-factor returns. Systematically decomposing the risk/return exposures of short-listed strategies (or APLs) introduces greater transparency that allows fiduciaries to better identify key characteristics.
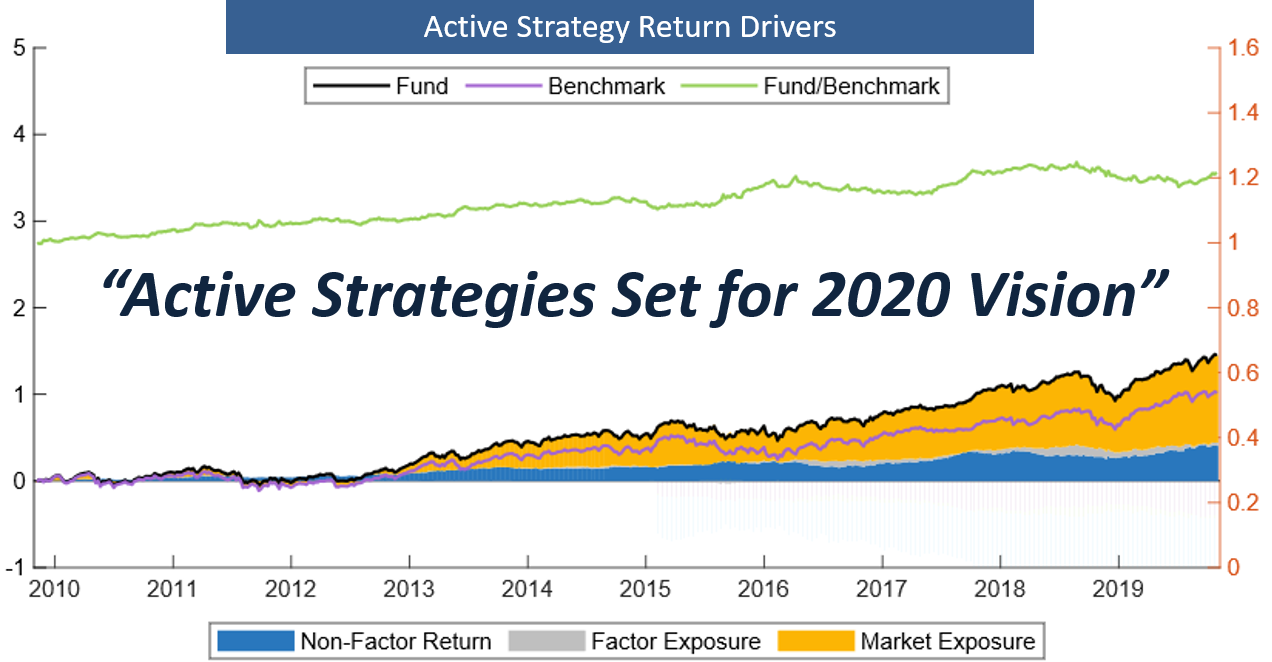
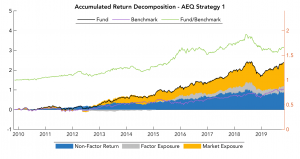
The following Accumulation charts decompose the: (1) market returns [yellow]; (2) factor returns [grey]; and (3) non-factor (alpha) returns [blue]; and provide examples of strategies that form our Reserve-list:
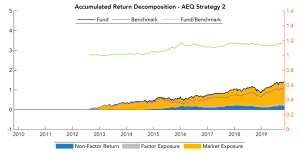
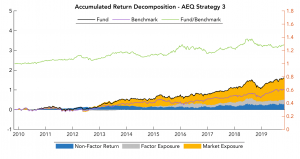
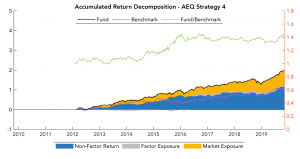
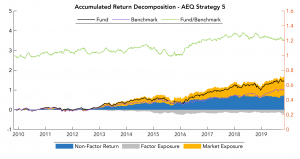
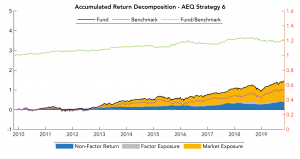
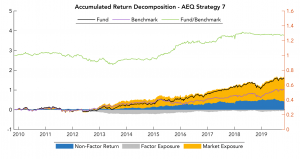
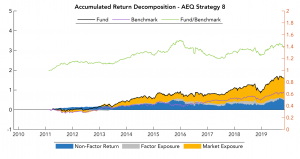
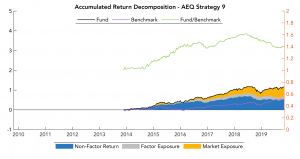
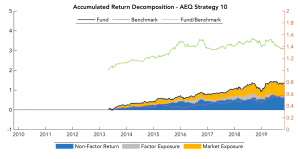
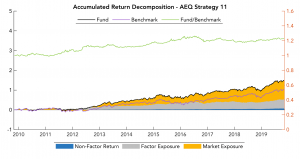
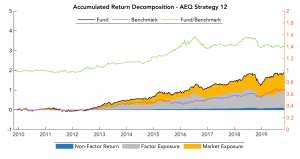
We note the following:
- each strategy has generated meaningful out-performance against the benchmark
- the bulk of returns have come from market beta (yellow) and secondarily from non-factor returns (blue)
- the last two (2) strategies are factor-based and unsurprisingly show higher levels of factor returns (grey)
- the green “Fund/Benchmark” line (RHS scale) plots each strategy’s return against the benchmark: an upward (downward) sloping curve denotes relative out(under)performance
Buoyant versus Volatile Market Conditions
We observed an average market beta of 0.85 across our 42 short-listed strategies, which predominately covers the post-GFC period. Just as a subdued level of market beta acts as a strong headwind during buoyant conditions, it also reduces downside risk when equity markets sell-off. While this is welcome in the current environment, we generally do not favor meaningful reductions in market beta over the full cycle as it requires strategies to consistently generate significant idiosyncratic (or factor-based) returns to compensate for forgone market returns.
While most active strategies struggled to add value against the benchmark under the buoyant conditions of recent years, the idiosyncratic and/or factor-based returns generated by the above strategies translated to 20% to 60% out-performance, as highlighted by the Fund/Benchmark line (RHS scale). We note the flat or downward sloping gradient for most strategies in recent years, which indicates performance has matched or lagged the benchmark.
Identifying and Monitoring Strategies
In reality, many “investment grade” strategies have not and are unlikely to pay their way, net of fees. Nonetheless, while the active gems identified above have experienced periods of under-performance, they have added significant value over time. We believe the current environment and the ensuing recovery will reward the better bottom-up, stock pickers through greater idiosyncratic return generation.
The challenge is to identify and monitor active strategies to understand their return drivers and to better appreciate the market conditions that are likely to favor them. Regular risk/return decomposition provides fiduciaries with the granular transparency needed to scrutinise active strategies against passive and factor-based investment options to improve overall portfolio construction.
Disclaimer

