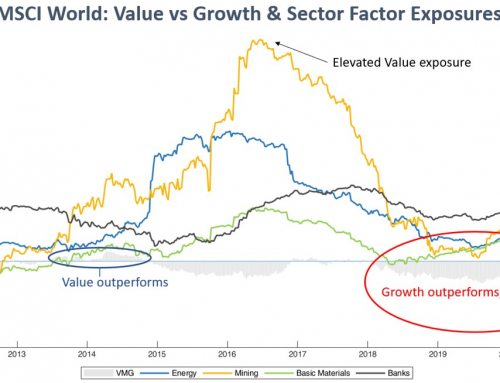
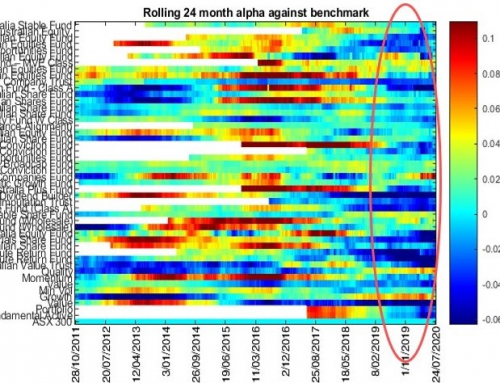
The yield curve is said to be negative or inverted when long term bond yields (generally 10 Year bonds) are lower than short term yields (generally 90 day bank bills), which foretells a slowdown in economic growth or potentially a recession.
The chart highlights that the US yield curve turned negative this year and stayed inverted for over 3 months, which has only occurred 4 times in the past 35 years.
The first was in 1989: 8 months after the yield curve started to invert, the S&P500 started to sell off & continued to do so for another 11 months. The official recession started 2 months later. The equity market was under its average long term value. Its drawdown was contained to around 15%.
The 2nd was in 2000: the equity market started to sell off 6 months before the yield curve started to invert. It continued to do so for another 26 months. The recession officially commenced 8 months after the initial yield curve inversion; and at this point US equities were valued at an all-time high. The market subsequently fell by 45%.
The 3nd was in 2006: the US equity market hadn’t recovered from its previous drawdown. It took 21 months after the initial yield curve inversion before the S&P500 started to sell down. It continued to do so for another 17 months. The official recession occurred 25 months after the initial yield curve inversion. US equity valuations were elevated. The S&P500 experienced a 51% drawdown.
The 4th is now: the yield curve inverted from May to October 2019. US equity valuations remain elevated. Will US equities soon significantly correct, as indicated by previous yield curve inversions, with likely flow on effects to other regions or is this 4th data point telling us something different ?
Central Bank Response
The yield curve is no longer inverted. The Fed has reduced the cash rate 3 times since July 2019. US 10 year Treasuries are now 0.21% higher than 90 day Treasuries, but that doesn’t necessarily mean we’re out of trouble. Past yield curve inversions turned positive on each occasion before the onset of a recession. It’s simply the byproduct of the Fed reducing rates in attempt to stimulate the economy. Ultimately, it couldn’t stop recessionary forces from taking hold in the last 3 occasions.
Perhaps the Fed is “ahead of the curve” this time and the US economy will avoid a recession. Time will tell, however there’s little room for error. The Fed has now reversed 75% of its 2018 tightening and its guidance needs to be balanced, measured and on-point; and this is precisely what we recently observed from US Fed Chair, Jerome Powell.
Just right
At his press conference last week, Jerome Powell said: “Monetary policy is in a good place” and further added that “household spending continues to be strong—supported by a healthy job market, rising incomes, and solid consumer confidence“. He also commented that “we would need to see a really significant move up in inflation that’s persistent before we even consider raising rates to address inflation concerns”.
The above guidance shows that Powell is confident that the economy is tracking well and that rates are likely to be on hold for some time. Any reference to further easing may signal that trouble lies ahead and spook markets; and we saw US equities fall by 20% over Q4/2018 in response to the Fed tightening by 1% over 2018. The Fed is effectively sandwiched in a “good place”.
Late Stage Market Cycle
Returning to our chart, we can see that history is telling us that we are in the final innings of the market cycle. Of course markets can move higher. Momentum is positive and US equities have already risen above previous highs. Strong returns have followed previous inversions before markets ultimately reversed. We now have intensifying calls for fiscal stimulus to keep the economy going, as monetary policy effectiveness reaches its limits.
It might be different as we head into 2020, but history tells us that we should be prudent at this time.
Disclaimer


